statsmodels.graphics.factorplots.interaction_plot
-
statsmodels.graphics.factorplots.interaction_plot(x, trace, response, func=
'mean', ax=None, plottype='b', xlabel=None, ylabel=None, colors=None, markers=None, linestyles=None, legendloc='best', legendtitle=None, **kwargs)[source]¶ Interaction plot for factor level statistics.
Note. If categorial factors are supplied levels will be internally recoded to integers. This ensures matplotlib compatibility. Uses a DataFrame to calculate an aggregate statistic for each level of the factor or group given by trace.
- Parameters:
- x : array_like
The x factor levels constitute the x-axis. If a pandas.Series is given its name will be used in xlabel if xlabel is None.
- trace : array_like
The trace factor levels will be drawn as lines in the plot. If trace is a pandas.Series its name will be used as the legendtitle if legendtitle is None.
- response : array_like
The reponse or dependent variable. If a pandas.Series is given its name will be used in ylabel if ylabel is None.
- func : function
Anything accepted by pandas.DataFrame.aggregate. This is applied to the response variable grouped by the trace levels.
- ax : axes, optional
Matplotlib axes instance
- plottype : str {'line', 'scatter', 'both'}, optional
The type of plot to return. Can be ‘l’, ‘s’, or ‘b’
- xlabel : str, optional
Label to use for x. Default is ‘X’. If x is a pandas.Series it will use the series names.
- ylabel : str, optional
Label to use for response. Default is ‘func of response’. If response is a pandas.Series it will use the series names.
- colors : list, optional
If given, must have length == number of levels in trace.
- markers : list, optional
If given, must have length == number of levels in trace
- linestyles : list, optional
If given, must have length == number of levels in trace.
- legendloc : {None, str, int}
Location passed to the legend command.
- legendtitle : {None, str}
Title of the legend.
- **kwargs
These will be passed to the plot command used either plot or scatter. If you want to control the overall plotting options, use kwargs.
- Returns:
The figure given by ax.figure or a new instance.
- Return type:
Figure
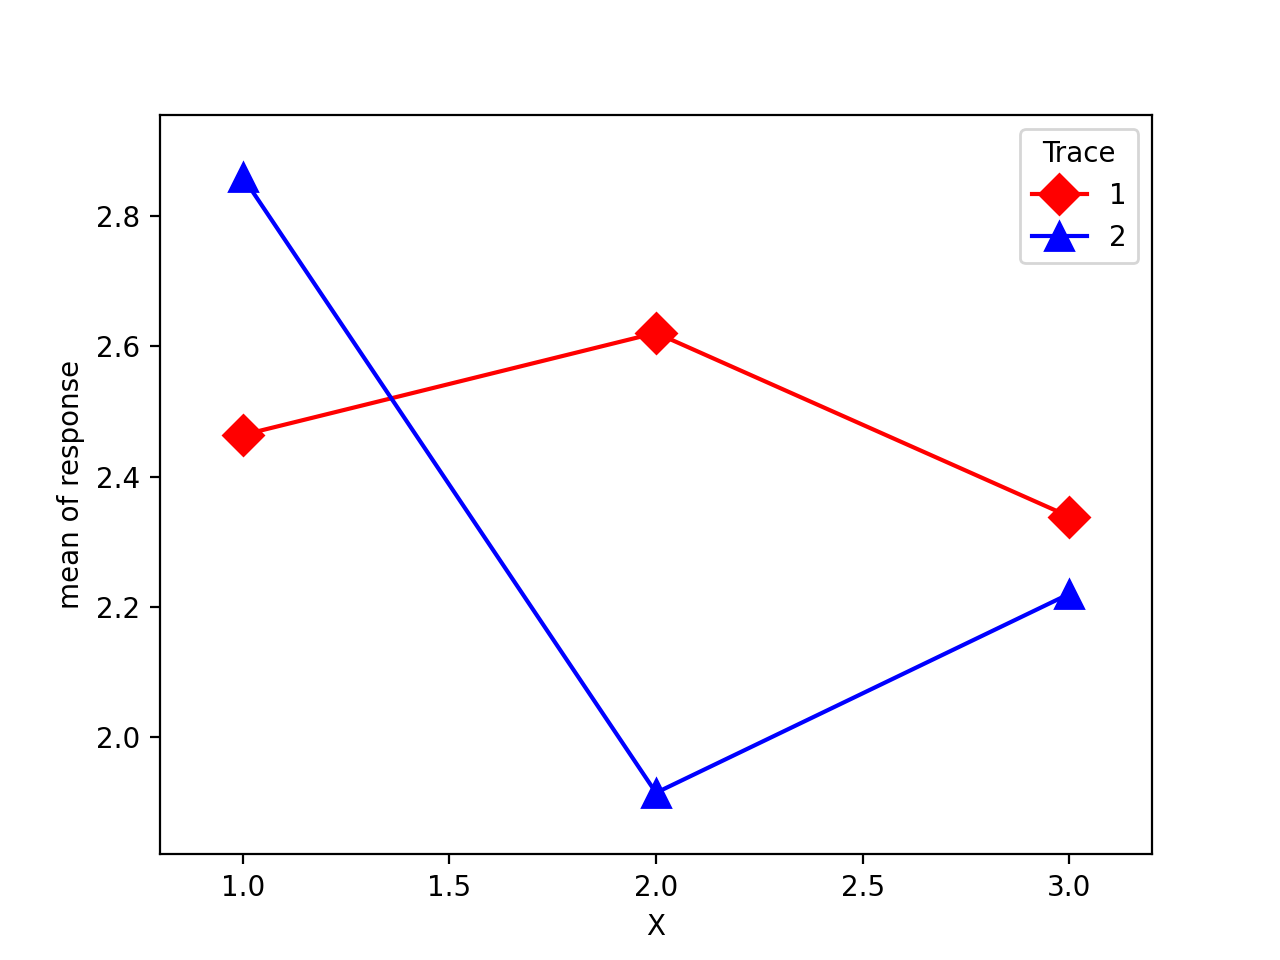
Examples
>>> import numpy as np
>>> np.random.seed(12345)
>>> weight = np.random.randint(1,4,size=60)
>>> duration = np.random.randint(1,3,size=60)
>>> days = np.log(np.random.randint(1,30, size=60))
>>> fig = interaction_plot(weight, duration, days,
...             colors=['red','blue'], markers=['D','^'], ms=10)
>>> import matplotlib.pyplot as plt
>>> plt.show()
(
Source code,png,hires.png,pdf)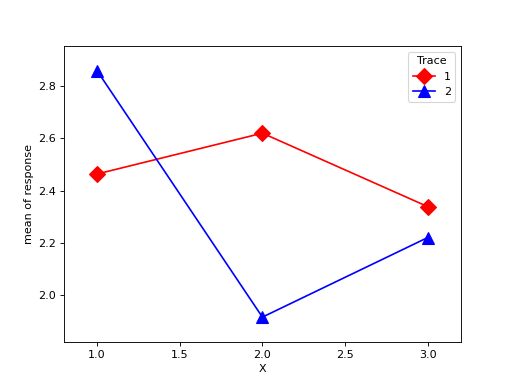