statsmodels.graphics.gofplots.qqline#
- statsmodels.graphics.gofplots.qqline(ax, line, x=None, y=None, dist=None, fmt='r-', **lineoptions)[source]#
Plot a reference line for a qqplot
- Parameters:
- ax
matplotlibaxesinstance The axes on which to plot the line
- line{“45”, “r”, “s”, “q”}
Options for the reference line to which the data is compared:
“45” - 45-degree line
- “s” - standardized line, the expected order statistics are scaled by
the standard deviation of the given sample and have the mean added to them
“r” - A regression line is fit
“q” - A line is fit through the quartiles.
- x
ndarray,optional X data for plot. Not needed if line is “45”.
- y
ndarray,optional Y data for plot. Not needed if line is “45”.
- dist
scipy.stats.distribution,optional A scipy.stats distribution, needed if line is “q”.
- fmt
str,optional Line format string passed to plot.
- **lineoptions
Additional arguments to be passed to the plot command.
- ax
Notes
There is no return value. The line is plotted on the given ax.
Examples
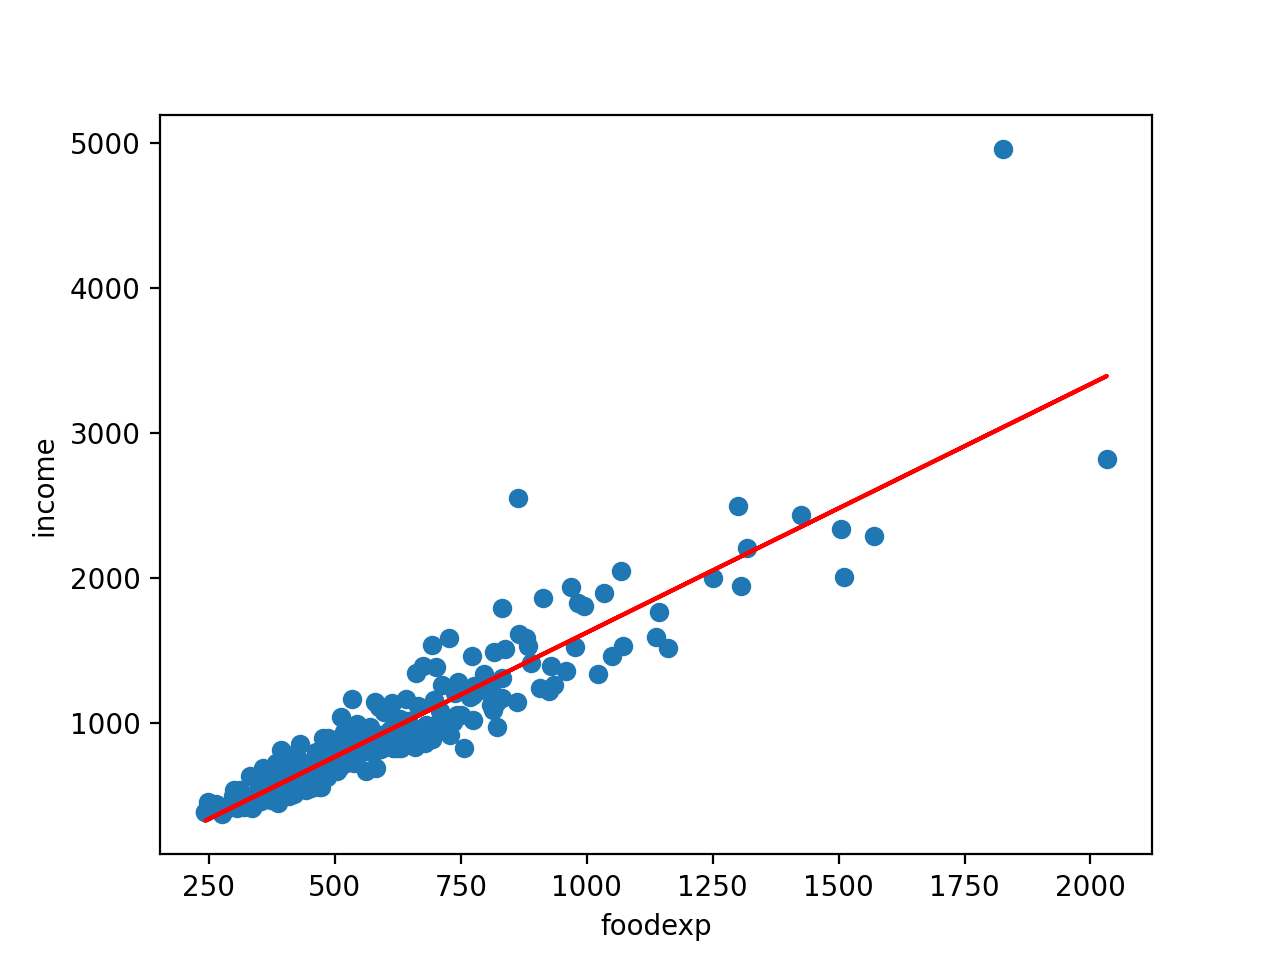
Import the food expenditure dataset. Plot annual food expenditure on x-axis and household income on y-axis. Use qqline to add regression line into the plot.
>>> import statsmodels.api as sm
>>> import numpy as np
>>> import matplotlib.pyplot as plt
>>> from statsmodels.graphics.gofplots import qqline
>>> foodexp = sm.datasets.engel.load()
>>> x = foodexp.exog
>>> y = foodexp.endog
>>> ax = plt.subplot(111)
>>> plt.scatter(x, y)
>>> ax.set_xlabel(foodexp.exog_name[0])
>>> ax.set_ylabel(foodexp.endog_name)
>>> qqline(ax, "r", x, y)
>>> plt.show()
(
Source code,png,hires.png,pdf)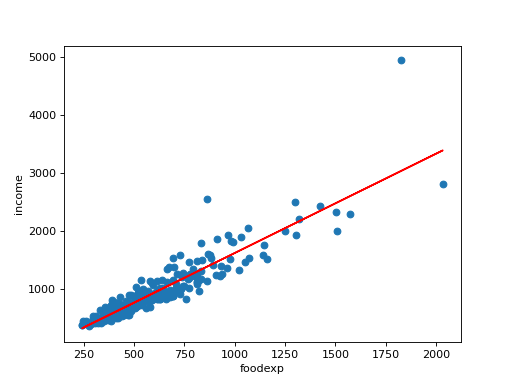