
statsmodels.graphics.regressionplots.plot_leverage_resid2
-
statsmodels.graphics.regressionplots.plot_leverage_resid2(results, alpha=0.05, ax=None, **kwargs)[source]¶ Plots leverage statistics vs. normalized residuals squared
- Parameters
- resultsresults instance
A regression results instance
- alphafloat
Specifies the cut-off for large-standardized residuals. Residuals are assumed to be distributed N(0, 1) with alpha=alpha.
- axAxes instance
Matplotlib Axes instance
- Returns
- figmatplotlib Figure
A matplotlib figure instance.
Examples
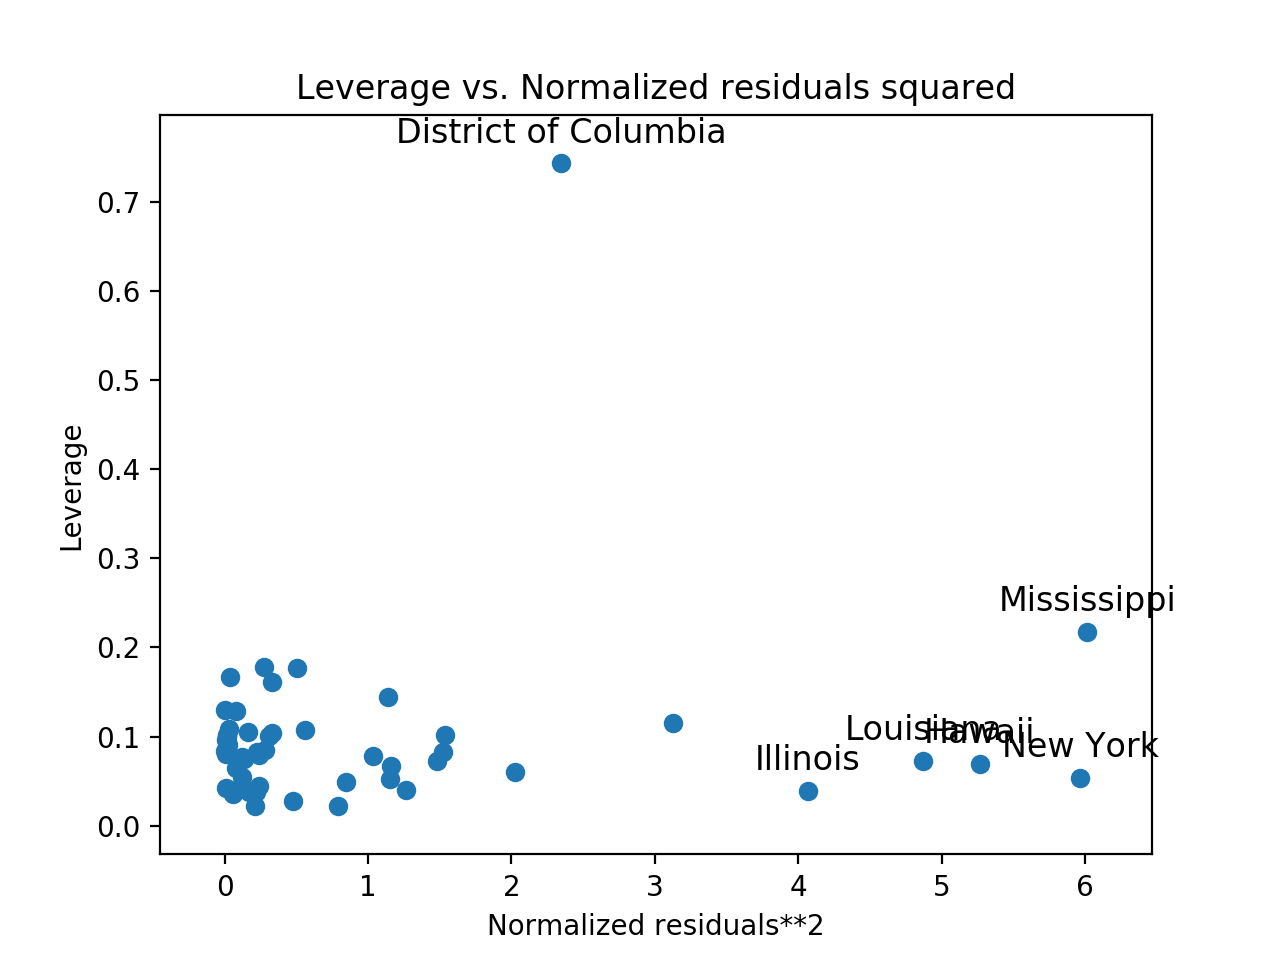
Using a model built from the the state crime dataset, plot the leverage statistics vs. normalized residuals squared. Observations with Large-standardized Residuals will be labeled in the plot.
>>> import statsmodels.api as sm
>>> import matplotlib.pyplot as plt
>>> import statsmodels.formula.api as smf
>>> crime_data = sm.datasets.statecrime.load_pandas()
>>> results = smf.ols('murder ~ hs_grad + urban + poverty + single',
...                   data=crime_data.data).fit()
>>> sm.graphics.plot_leverage_resid2(results)
>>> plt.show()
(Source code, png, hires.png, pdf)
