statsmodels.graphics.regressionplots.plot_partregress#
- statsmodels.graphics.regressionplots.plot_partregress(endog, exog_i, exog_others, data=None, title_kwargs=None, obs_labels=True, label_kwargs=None, ax=None, ret_coords=False, eval_env=1, *, result_object=None, **kwargs)[source]#
Plot partial regression for a single regressor
- Parameters:
- endogarray_like or
str The endogenous or response variable. If string is given, you can use arbitrary translations as with a formula.
- exog_iarray_like or
str The exogenous, explanatory variable. If string is given, you can use arbitrary translations as with a formula.
- exog_othersarray_like,
str,orlist[str] Any other exogenous, explanatory variables. If a string is given, it is used directly as the right-hand side of a formula. If a list of strings is given, each item is a term in formula. You can use arbitrary translations as with a formula. The effect of these variables will be removed by OLS regression.
- data
DataFrameordict,optional Some kind of data structure with names if the other variables are given as strings.
- title_kwargs
dict,optional Keyword arguments to pass on for the title. The key to control the fonts is fontdict.
- obs_labelsbool or array_like,
optional Whether or not to annotate the plot points with their observation labels. If obs_labels is a boolean, the point labels will try to do the right thing. First it will try to use the index of data, then fall back to the index of exog_i. Alternatively, you may give an array-like object corresponding to the observation numbers.
- label_kwargs
dict,optional Keyword arguments that control annotate for the observation labels.
- ax
AxesSubplot,optional If given, this subplot is used to plot in instead of a new figure being created.
- ret_coordsbool,
optional If True will return the coordinates of the points in the plot. You can use this to add your own annotations.
- eval_env
int,optional Patsy eval environment if user functions and formulas are used in defining endog or exog.
- result_objectbool,
optional Flag controlling whether a
PartRegressPlotResultNamedTuple is returned. Whenret_coordsis True aPartRegressPlotResultis always returned; it holds the same two elements as the legacy(fig, coords)tuple, so it unpacks and indexes identically. Otherwise a bare figure is returned unlessresult_object=True.Deprecated since version 0.15.0: When
ret_coords=False, in release 0.16.0 or after July 2027, whichever is later, the default will change to return aPartRegressPlotResultrather than a bare figure. Setresult_object=Trueto opt in now, orresult_object=Falseto silence the warning and keep the current return type.- **kwargs
The keyword arguments passed to plot for the points.
- endogarray_like or
- Returns:
PartRegressPlotResultorFigureWhen
ret_coordsis True (orresult_object=True), a NamedTuple with fields:- figFigure
If ax is None, the created figure. Otherwise the figure to which ax is connected.
- coordstuple of ndarray or None
The
(x_coords, y_coords)of the plotted points. Always populated, including whenret_coords=False, because the residuals are computed to draw the plot;Noneonly when there were no other regressors to partial out.
PartRegressPlotResulthas the same length and contents as the plain(fig, coords)tuple it replaces, so it unpacks and indexes identically. SeePartRegressPlotResult.When
ret_coordsis False a bare figure is returned instead.
See also
plot_partregress_gridPlot partial regression for a set of regressors.
Notes
The slope of the fitted line is the that of exog_i in the full multiple regression. The individual points can be used to assess the influence of points on the estimated coefficient.
Examples
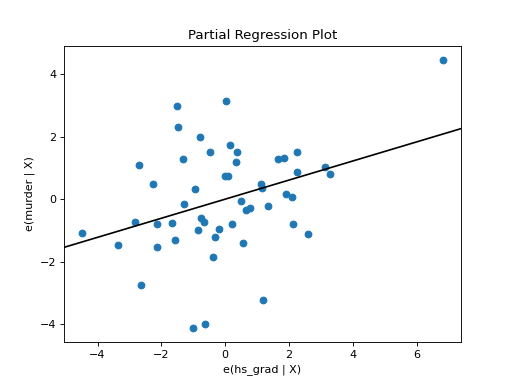
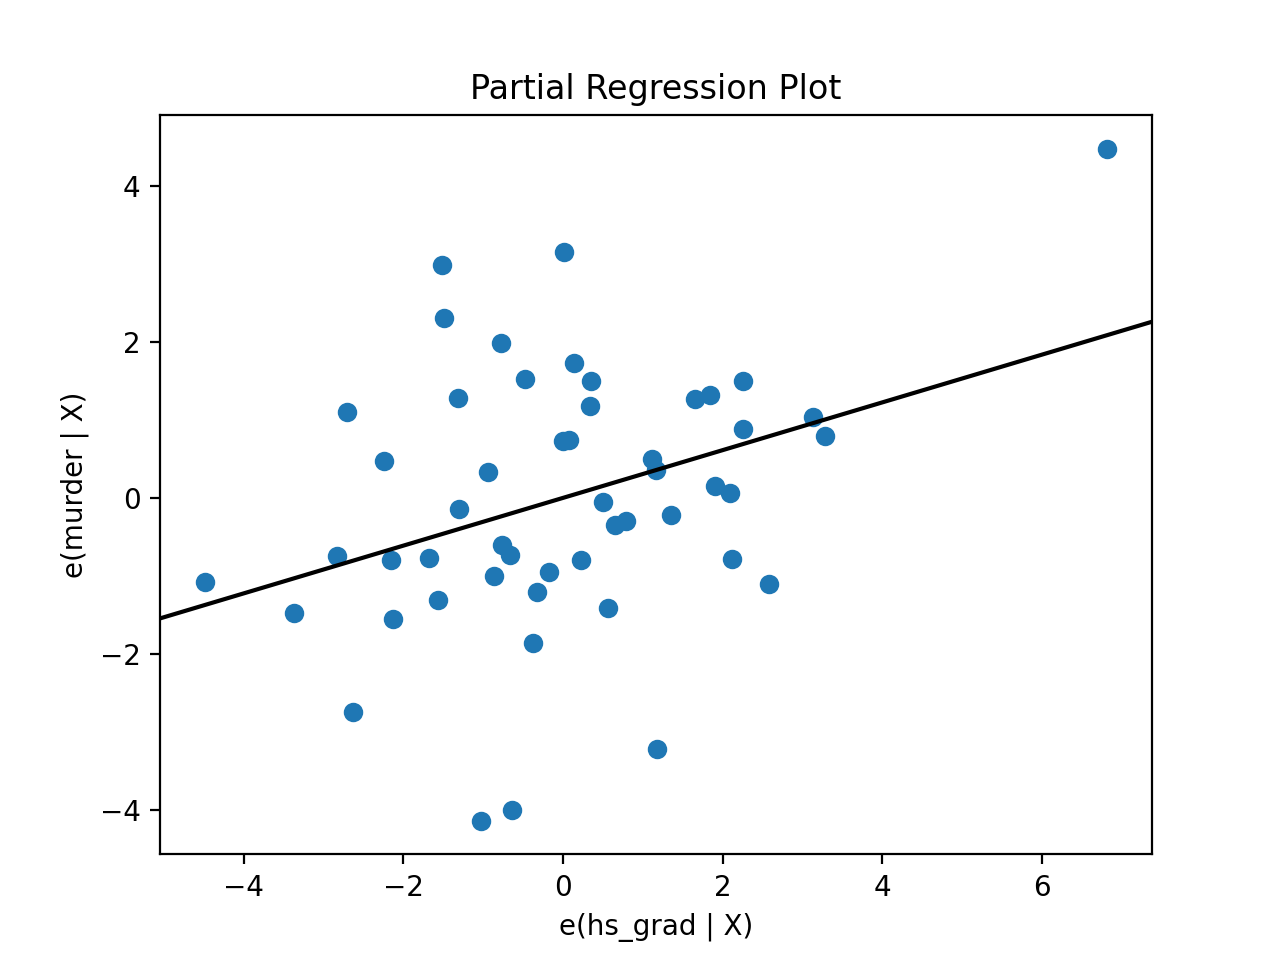
Load the Statewide Crime data set and plot partial regression of the rate of high school graduation (hs_grad) on the murder rate(murder).
The effects of the percent of the population living in urban areas (urban), below the poverty line (poverty) , and in a single person household (single) are removed by OLS regression.
>>> import statsmodels.api as sm
>>> crime_data = sm.datasets.statecrime.load_pandas()
>>> sm.graphics.plot_partregress(endog='murder', exog_i='hs_grad',
...                              exog_others=['urban', 'poverty', 'single'],
...                              data=crime_data.data, obs_labels=False,
...                              result_object=True)
>>> plt.show()
(
Source code,png,hires.png,pdf)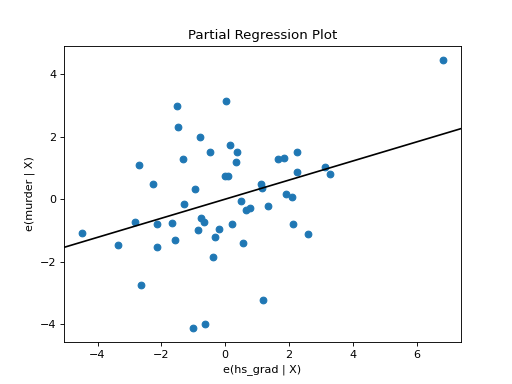
More detailed examples can be found in the Regression Plots notebook on the examples page.