statsmodels.graphics.tsaplots.plot_pacf#
- statsmodels.graphics.tsaplots.plot_pacf(x, ax=None, lags=None, alpha=0.05, method='ywm', use_vlines=True, title='Partial Autocorrelation', zero=True, vlines_kwargs=None, **kwargs)[source]#
Plot the partial autocorrelation function
- Parameters:
- xarray_like
Array of time-series values
- ax
AxesSubplot,optional If given, this subplot is used to plot in instead of a new figure being created.
- lags{
int, array_like},optional An int or array of lag values, used on horizontal axis. Uses np.arange(lags) when lags is an int. If not provided,
lags=np.arange(len(corr))is used.- alpha
float,optional If a number is given, the confidence intervals for the given level are returned. For instance if alpha=.05, 95 % confidence intervals are returned where the standard deviation is computed according to 1/sqrt(len(x))
- method
str,optional Specifies which method for the calculations to use:
“ywm” or “ywmle” : Yule-Walker without adjustment. Default.
“yw” or “ywadjusted” : Yule-Walker with sample-size adjustment in denominator for acovf.
“ols” : regression of time series on lags of it and on constant.
“ols-inefficient” : regression of time series on lags using a single common sample to estimate all pacf coefficients.
“ols-adjusted” : regression of time series on lags with a bias adjustment.
“ld” or “ldadjusted” : Levinson-Durbin recursion with bias correction.
“ldb” or “ldbiased” : Levinson-Durbin recursion without bias correction.
- use_vlinesbool,
optional If True, vertical lines and markers are plotted. If False, only markers are plotted. The default marker is ‘o’; it can be overridden with a
markerkwarg.- title
str,optional Title to place on plot. Default is ‘Partial Autocorrelation’
- zerobool,
optional Flag indicating whether to include the 0-lag autocorrelation. Default is True.
- vlines_kwargs
dict,optional Optional dictionary of keyword arguments that are passed to vlines.
- **kwargs
kwargs,optional Optional keyword arguments that are directly passed on to the Matplotlib
plotandaxhlinefunctions.
- Returns:
FigureIf ax is None, the created figure. Otherwise the figure to which ax is connected.
Notes
Plots lags on the horizontal and the correlations on vertical axis. Adapted from matplotlib’s xcorr.
Data are plotted as
plot(lags, corr, **kwargs)kwargs is used to pass matplotlib optional arguments to both the line tracing the autocorrelations and for the horizontal line at 0. These options must be valid for a Line2D object.
vlines_kwargs is used to pass additional optional arguments to the vertical lines connecting each autocorrelation to the axis. These options must be valid for a LineCollection object.
Examples
>>> import pandas as pd
>>> import matplotlib.pyplot as plt
>>> import statsmodels.api as sm
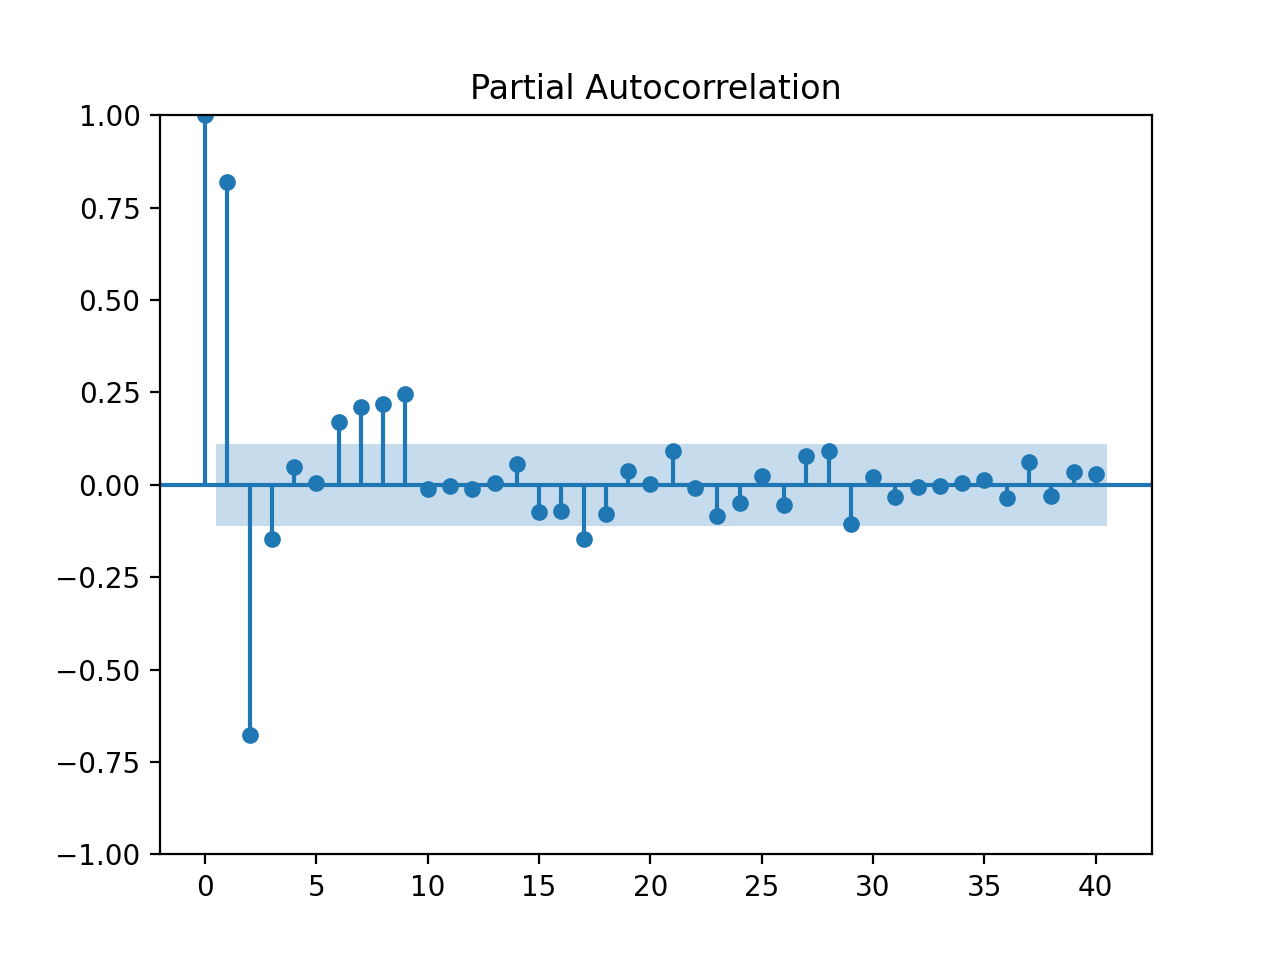
>>> dta = sm.datasets.sunspots.load_pandas().data
>>> dta.index = pd.Index(sm.tsa.datetools.dates_from_range('1700', '2008'))
>>> del dta["YEAR"]
>>> sm.graphics.tsa.plot_pacf(dta.values.squeeze(), lags=40, method="ywm")
>>> plt.show()
(
Source code,png,hires.png,pdf)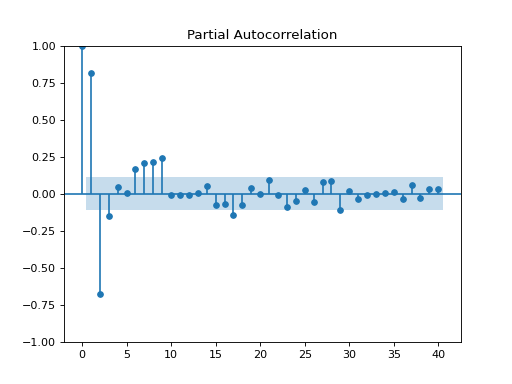