statsmodels.graphics.regressionplots.plot_ceres_residuals#
- statsmodels.graphics.regressionplots.plot_ceres_residuals(results, focus_exog, frac=0.66, cond_means=None, ax=None)[source]#
Conditional Expectation Partial Residuals (CERES) plot
Produce a CERES plot for a fitted regression model.
- Parameters:
- results
Results Results instance of a fitted regression model.
- focus_exog{
int,str} The column index of results.model.exog, or the variable name, indicating the variable whose role in the regression is to be assessed.
- frac
float Lowess tuning parameter for the adjusted model used in the CERES analysis. Not used if cond_means is provided.
- cond_meansarray_like,
optional If provided, the columns of this array span the space of the conditional means E[exog | focus exog], where exog ranges over some or all of the columns of exog (other than the focus exog).
- ax
matplotlib.Axesinstance,optional The axes on which to draw the plot. If not provided, a new axes instance is created.
- results
- Returns:
FigureThe figure on which the partial residual plot is drawn.
Notes
cond_means is intended to capture the behavior of E[x1 | x2], where x2 is the focus exog and x1 are all the other exog variables. If all the conditional mean relationships are linear, it is sufficient to set cond_means equal to the focus exog. Alternatively, cond_means may consist of one or more columns containing functional transformations of the focus exog (e.g. x2^2) that are thought to capture E[x1 | x2].
If nothing is known or suspected about the form of E[x1 | x2], set cond_means to None, and it will be estimated by smoothing each non-focus exog against the focus exog. The values of frac control these lowess smooths.
If cond_means contains only the focus exog, the results are equivalent to a partial residual plot.
If the focus variable is believed to be independent of the other exog variables, cond_means can be set to an (empty) nx0 array.
References
[1]RD Cook and R Croos-Dabrera (1998). Partial residual plots in generalized linear models. Journal of the American Statistical Association, 93:442.
[2]RD Cook (1993). Partial residual plots. Technometrics 35:4.
Examples
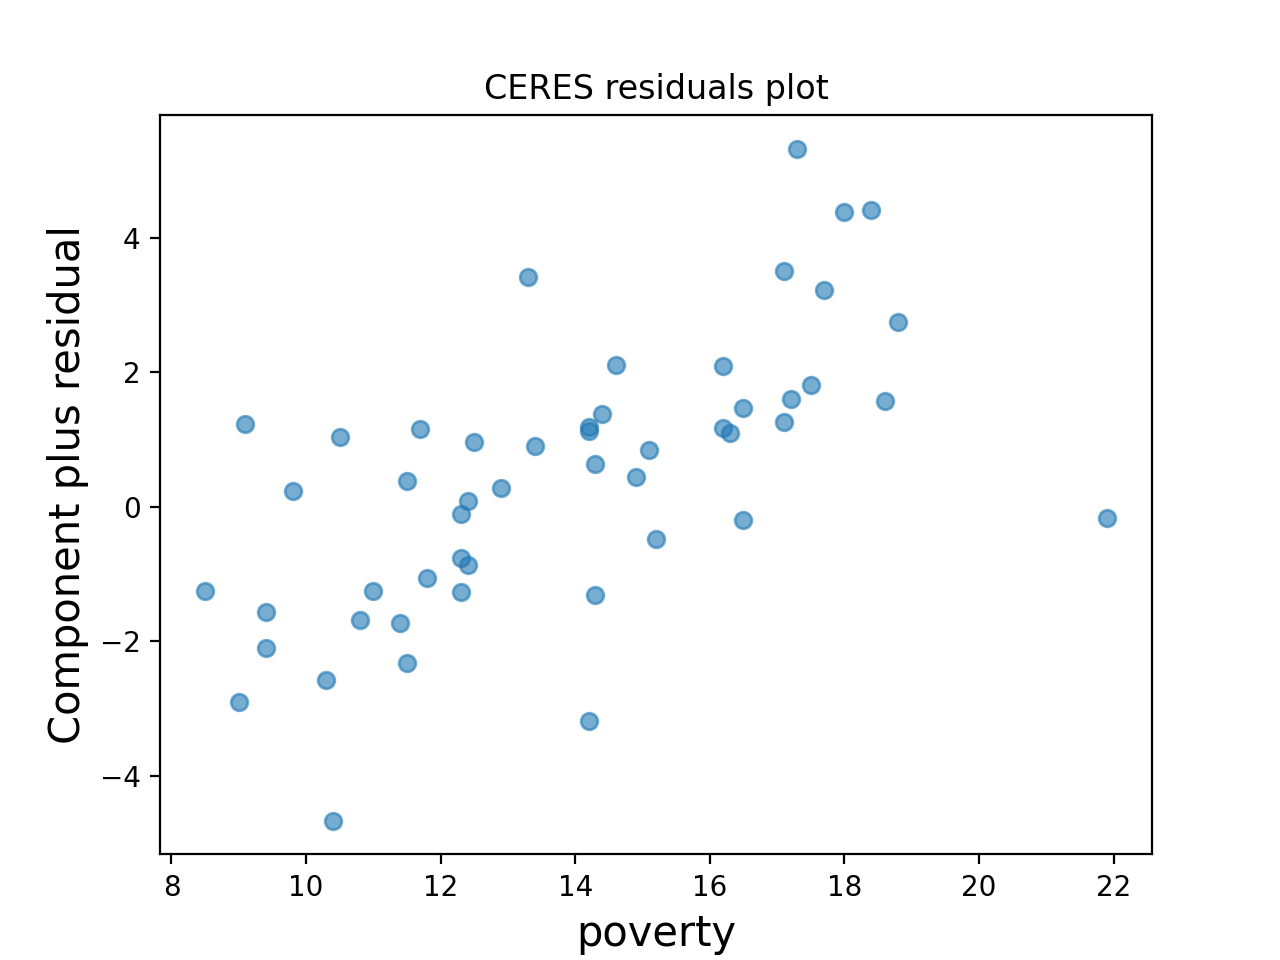
Using a model built from the state crime dataset, make a CERES plot with the rate of Poverty as the focus variable.
>>> import statsmodels.api as sm
>>> import matplotlib.pyplot as plt
>>> import statsmodels.formula.api as smf
>>> from statsmodels.graphics.regressionplots import plot_ceres_residuals
>>> crime_data = sm.datasets.statecrime.load_pandas()
>>> results = smf.ols('murder ~ hs_grad + urban + poverty + single',
...                   data=crime_data.data).fit()
>>> plot_ceres_residuals(results, 'poverty')
>>> plt.show()
(
Source code,png,hires.png,pdf)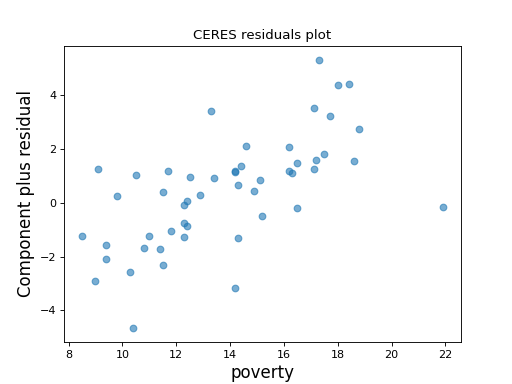