statsmodels.graphics.regressionplots.plot_partregress_grid
-
statsmodels.graphics.regressionplots.plot_partregress_grid(results, exog_idx=
None, grid=None, fig=None)[source]¶ Plot partial regression for a set of regressors.
- Parameters:
- results : Results instance
A regression model results instance.
- exog_idx : {None, list[int], list[str]}
The indices or column names of the exog used in the plot, default is all.
- grid : {None, tuple[int]}
If grid is given, then it is used for the arrangement of the subplots. The format of grid is (nrows, ncols). If grid is None, then ncol is one, if there are only 2 subplots, and the number of columns is two otherwise.
- fig : Figure, optional
If given, this figure is simply returned. Otherwise a new figure is created.
- Returns:
If fig is None, the created figure. Otherwise fig itself.
- Return type:
Figure
See also
plot_partregressPlot partial regression for a single regressor.
plot_ccprPlot CCPR against one regressor
Notes
A subplot is created for each explanatory variable given by exog_idx. The partial regression plot shows the relationship between the response and the given explanatory variable after removing the effect of all other explanatory variables in exog.
References
See http://www.itl.nist.gov/div898/software/dataplot/refman1/auxillar/partregr.htm
Examples
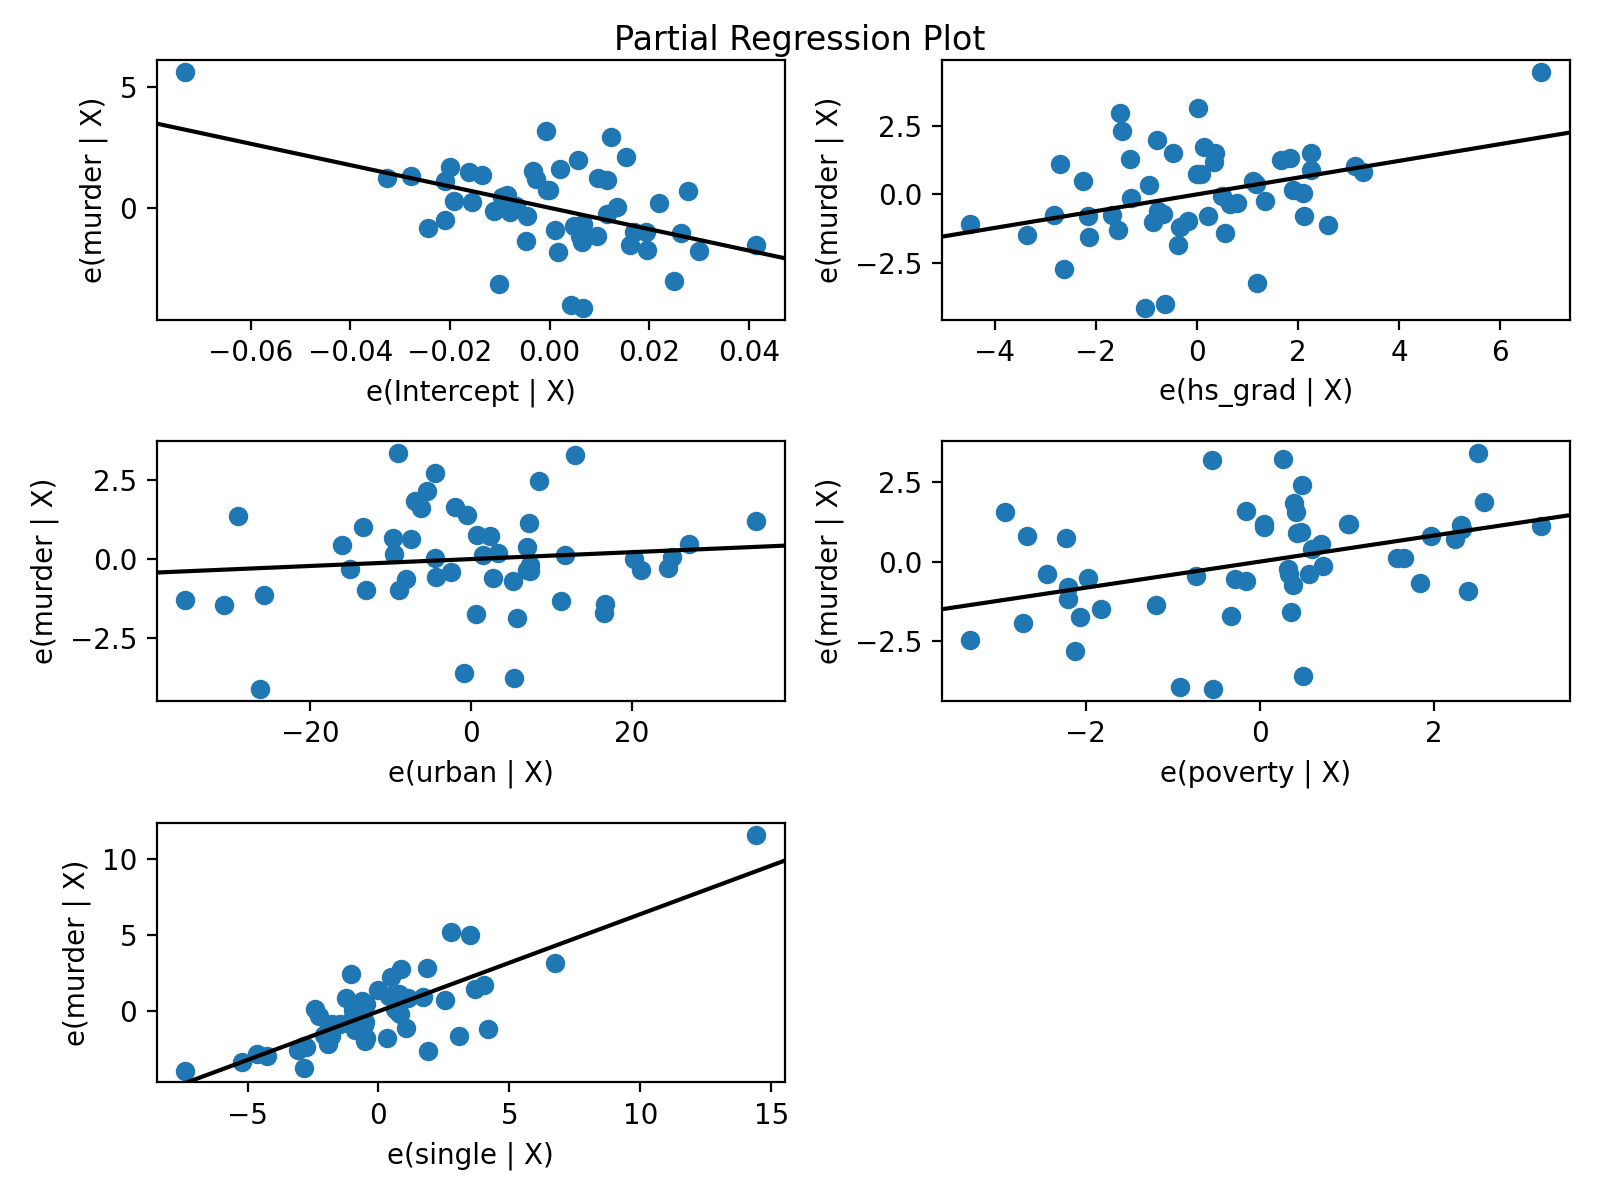
Using the state crime dataset separately plot the effect of the each variable on the on the outcome, murder rate while accounting for the effect of all other variables in the model visualized with a grid of partial regression plots.
>>> from statsmodels.graphics.regressionplots import plot_partregress_grid
>>> import statsmodels.api as sm
>>> import matplotlib.pyplot as plt
>>> import statsmodels.formula.api as smf
>>> fig = plt.figure(figsize=(8, 6)) >>> crime_data = sm.datasets.statecrime.load_pandas() >>> results = smf.ols('murder ~ hs_grad + urban + poverty + single', ... data=crime_data.data).fit() >>> plot_partregress_grid(results, fig=fig) >>> plt.show()(
Source code,png,hires.png,pdf)