statsmodels.graphics.plot_grids.scatter_ellipse#
- statsmodels.graphics.plot_grids.scatter_ellipse(data, level=0.9, varnames=None, ell_kwds=None, plot_kwds=None, add_titles=False, keep_ticks=False, fig=None)[source]#
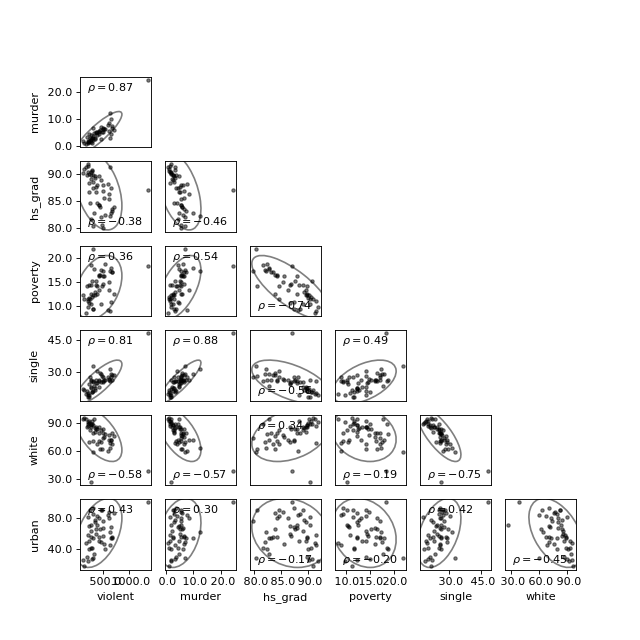
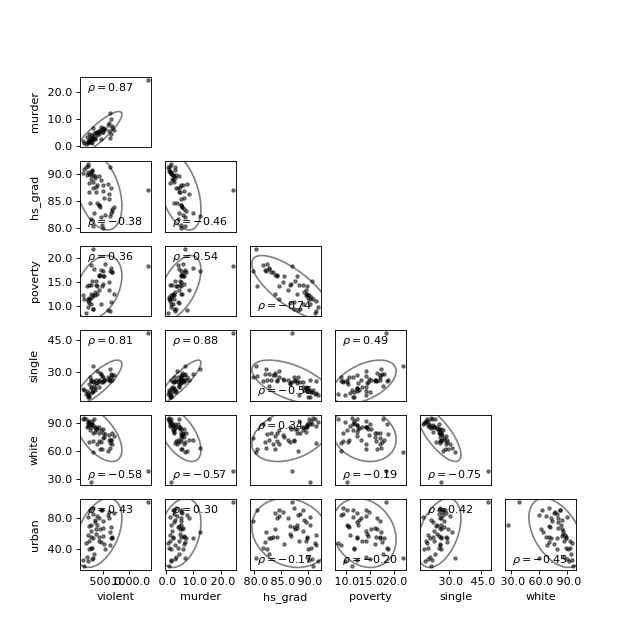
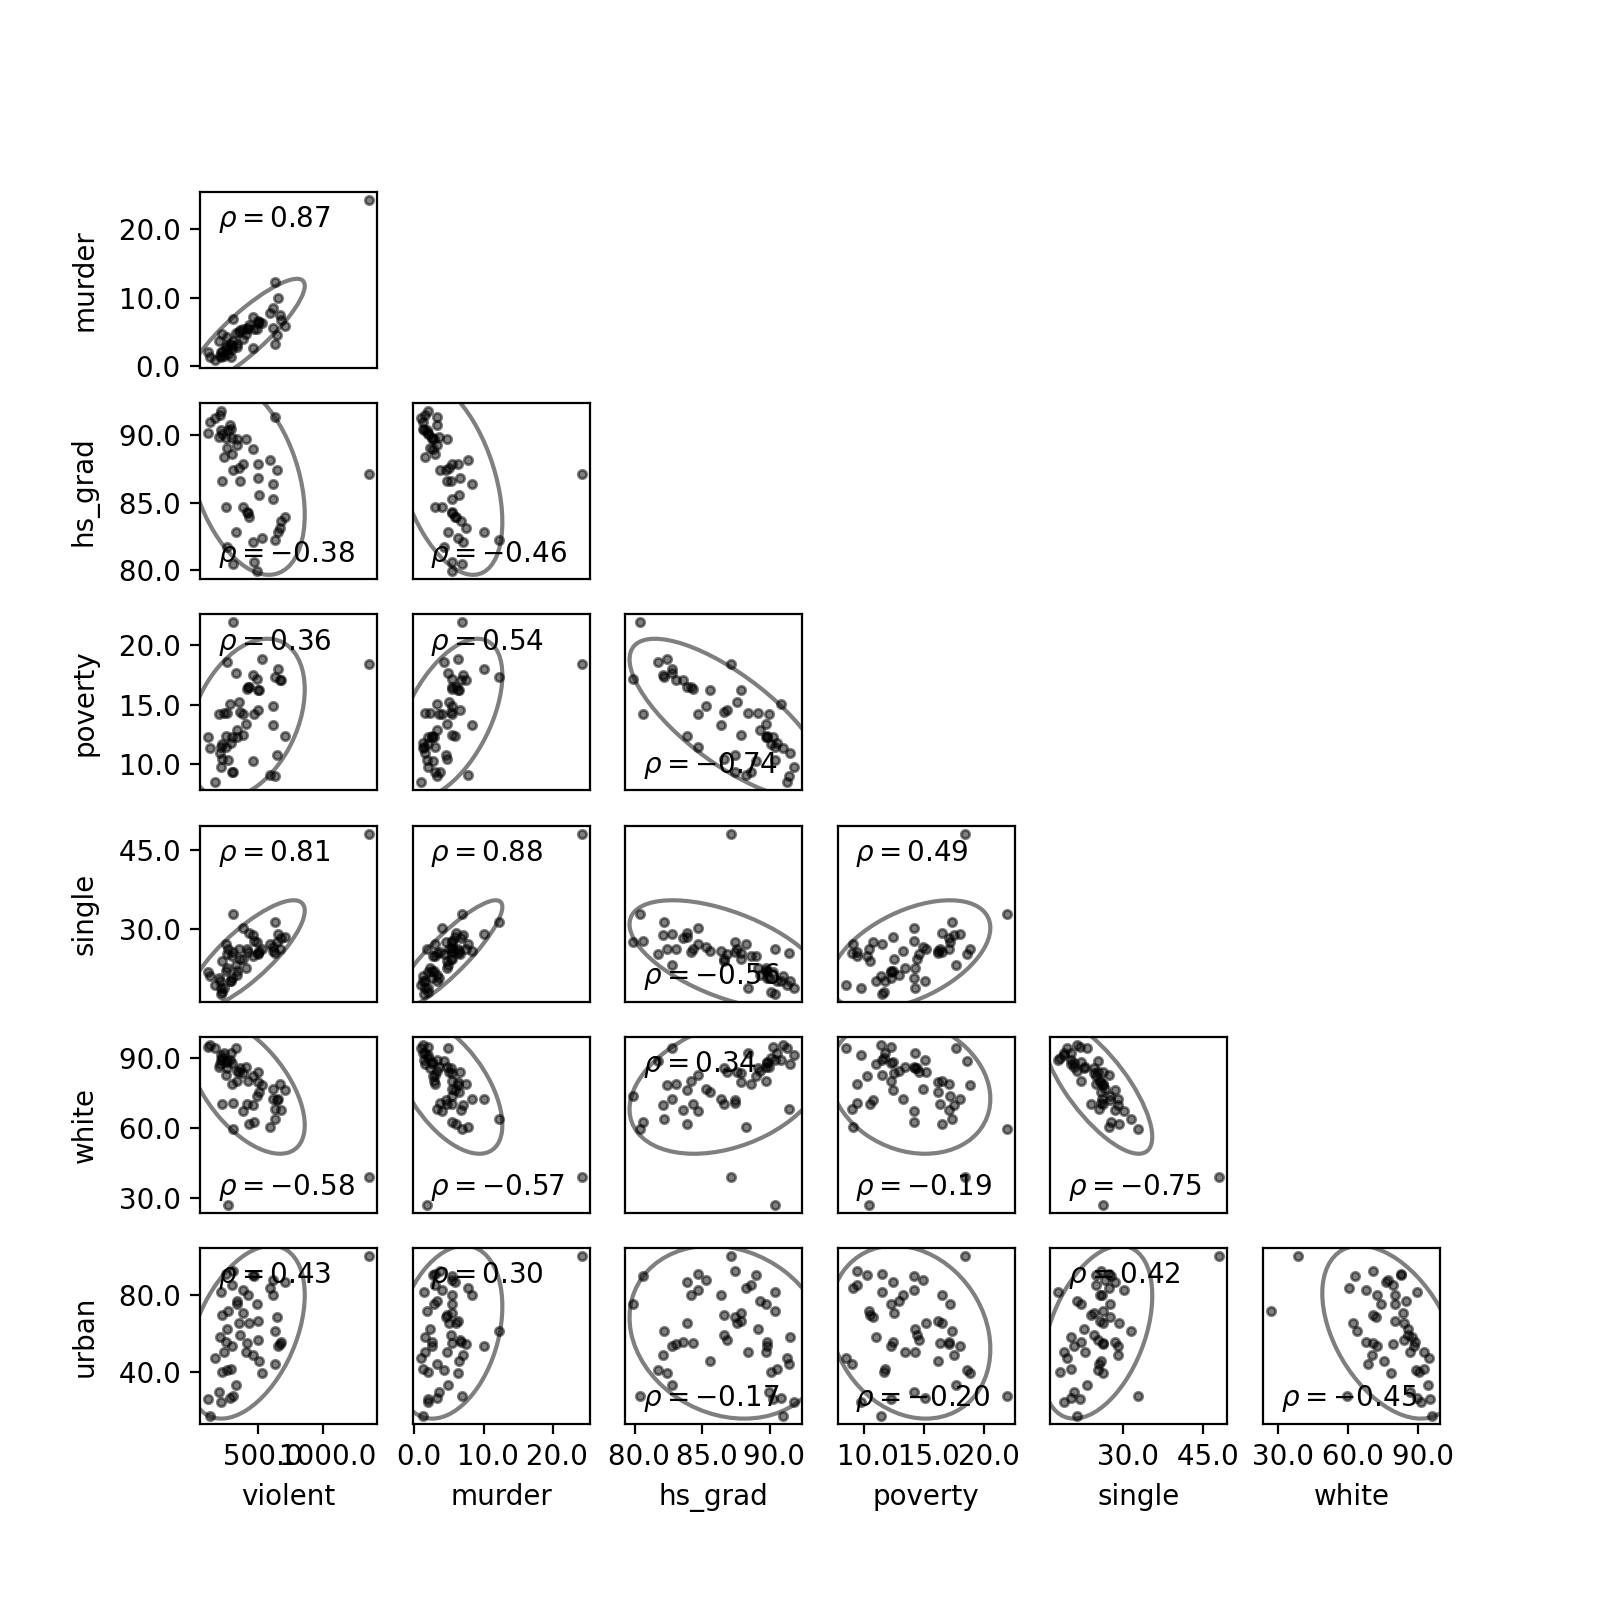
Create a grid of scatter plots with confidence ellipses
- Parameters:
- dataarray_like
Input data.
- level
floatorlistoffloat,optional The confidence level(s) of the ellipses to draw. Default is 0.9.
- varnames
list[str],optional Variable names. Used for y-axis labels, and if add_titles is True also for titles. If not given, integers 1..data.shape[1] are used.
- ell_kwds
dict,optional Additional keyword arguments passed to the ellipse patches drawn on each subplot.
- plot_kwds
dict,optional Additional keyword arguments passed to the scatter points plotted on each subplot.
- add_titlesbool,
optional Whether or not to add titles to each subplot. Default is False. Titles are constructed from varnames.
- keep_ticksbool,
optional If False (default), remove all axis ticks.
- fig
Figure,optional If given, this figure is simply returned. Otherwise a new figure is created.
- Returns:
FigureIf fig is None, the created figure. Otherwise fig itself.
Notes
Looks reasonable with 5 or 6 variables, becomes too crowded with 8 and too sparse with 1.
Examples
>>> import statsmodels.api as sm
>>> import matplotlib.pyplot as plt
>>> import numpy as np
>>> from statsmodels.graphics.plot_grids import scatter_ellipse
>>> data = sm.datasets.statecrime.load_pandas().data
>>> fig = plt.figure(figsize=(8,8))
>>> scatter_ellipse(data, varnames=data.columns, fig=fig)
>>> plt.show()
(
Source code,png,hires.png,pdf)